comparison.md — how mc compares, measured against C, Go, Zig, Rust and C# (2026-09-06)
Two benchmarks, run on one Mac, comparing mc against five real toolchains on the same code: a
CPU-bound integer workload compiled and run by all six, and 17 minimal HTTP servers under load
(nine in the first set: mc, C, Go, Zig, Rust threads, C#; eight more in a second set: Node,
Rust axum, Python, Ruby, PHP). Every command, every number and every failure hit along the way
is in ../bench/RESULTS.md, ../bench/http/RESULTS.md
and ../bench/http2/RESULTS.md; this page is the five-minute version.
The benchmark sources are in ../bench/ and build with the same mc this
repository builds — nothing here is a projection.
Conditions #
| Hardware | Apple M4, Mac16,12, 10 cores, 16 GiB RAM |
| OS | macOS 26.6.2 (Darwin 25.6.0) |
| Go | go1.26.4 darwin/arm64 |
| Zig | 0.16.0 |
| Rust | rustc 1.96.0 (ac68faa20 2026-05-25) |
| .NET | SDK 10.0.301, runtime 10.0.9 |
| C | Apple clang 21.0.0 (clang-2100.1.1.101) |
| mc | commit 0648e1a (tag v0.15.13), build/mc1, mc 0.0.0-dev |
| Node (2nd HTTP set) | v24.16.0 (nvm) |
| Rust axum (2nd HTTP set) | axum 0.8.9, hyper 1.11.1, tokio 1.53.1 (cargo 1.96.0, same rustc as above) |
| Python (2nd HTTP set) | 3.9.6 (Apple /usr/bin/python3 shim), uvicorn 0.39.0 (h11 0.16.0, no httptools/uvloop) |
| Ruby (2nd HTTP set) | 2.6.10p210 (Apple /usr/bin/ruby shim), puma 6.6.1 |
| PHP (2nd HTTP set) | 8.5.10 (cli, NTS, Homebrew) |
| Load generators | ApacheBench (ab) 2.3, oha 1.16.0 |
| Method | best of 3 timed runs, /usr/bin/time -l for wall clock and max RSS, a warm-up run before each measured one, ps sampled every 0.5 s for the HTTP servers, ulimit -n raised, TIME_WAIT drained between HTTP runs |
| Date | 2026-09-06 |
The hour-long soak below (§ "The hour under load") is a separate measurement, on separate hardware: it runs on GitHub's hosted Actions runners (one per server, four vCPU each), not on the Apple M4 this table describes -- its own conditions block gives the runner, kernel and toolchain versions for that run.
The HTTP tables below merge two measurement sets on the same host, back to back: the first (mc, C, Go, Zig, Rust threads, C#) ran to completion before the second (Node single/cluster, Rust axum, Python, Ruby, PHP) was started, so neither harness's load competed with the other's for the ten cores. Every command and number for the second set is in ../bench/http2/RESULTS.md.
The cell of record #
The table above is one developer's Mac, and it is labelled as one. The reference measurement is
the reproducible cell of specs/M50.md — one GitHub Actions job per toolchain on
three cells, clang -O2 of the same program built and timed inside every job as the reference, a
release tarball whose .sha256 the job verifies before unpacking, and every binary recorded by
SHA-256. Its runs are committed as dated JSON, so a regression is a git blame and not a chat log.
Run 34783020976, 2026-09-13,
committed at bench/results/2026-09-13-34783020976/:
| cell | machine | mc | asset SHA-256 | binary SHA-256, bytes | reference clang -O2, whole workload |
|---|---|---|---|---|---|
macos-arm64-macos-15 | Apple M1 (Virtual), image macos15 20260907.0337.1, Apple clang 17.0.0, nothing pinned | mc 0.15.34 (v0.15.34, mc-0.15.34-macos-arm64.tar.gz) | 7dedb269…1e64b864 | 5980c681…70d6dbc8, 1,400,287 | 0.719 s |
linux-arm64-ubuntu-24.04-arm | arm64 Linux, image ubuntu24-arm64 20260907.118.1, Ubuntu clang 18.1.3, taskset -c 0 (no CPU model: arm64 /proc/cpuinfo has none) | mc 0.15.34 (v0.15.34, mc-0.15.34-linux-arm64.tar.gz) | aa6f2078…bb51ffce | 41fab98c…0e5f3621, 1,432,768 | 0.381 s |
linux-x86_64-ubuntu-latest | AMD EPYC 7763, image ubuntu24 20260907.300.1, Ubuntu clang 18.1.3, taskset -c 0 | mc 0.15.34 (v0.15.34, mc-0.15.34-linux-x86_64.tar.gz) | 2134e496…f1acc840 | 804135cf…3da1f0d858, 1,446,104 | 0.569 s |
Pins for that run, from ../bench/cell/versions.env: clang-18 on
Linux, go1.26.7, zig 0.16.0, rustc 1.96.0, .NET SDK 10.0.400 — each recorded as the tool itself
printed it, never as the pin claimed. Seven repetitions per row, interleaved, the first dropped;
TOLERANCE = 0.05 on a row's ratio and the teeth (mc --opt=0 against mc --opt=1 on the mix
phase) floored at 1.5 on AArch64 and 1.10 on x86-64. 17.2 minutes of runner time for all three
cells.
What the cell fixed, and what no machine can fix. The two caveats this block used to carry are
gone. The stale tree label — the workload binary reporting e5a1643, a real commit that is not the
one that produced it — is structurally impossible now: the cell records the SHA-256 of the tarball
it verified and of the binary it timed, and a digest cannot go stale. The shared host is not
cured by any machine this project can reach, and the cell does not pretend otherwise; what it does
instead is compare only numbers taken in the same run, on the same core, in the same minute, and
report the reference's own absolute median as the machine's health indicator. Between two runs of
that cell twenty minutes apart, ubuntu-latest came up as an AMD EPYC 7763 and then as an Intel
Xeon 8573C, and macos-15's reference median moved by up to 31.8% between jobs — both visible in
the committed JSON, neither hidden. So absolute seconds on this page are a snapshot of one machine
on one day, and only the ratios are comparable across runs.
The HTTP tables keep their own caveat and it is unchanged: one host, the load generator sharing the
cores it measures. ../bench/http/RESULTS.md § Notes 13 names three runs whose numbers swing ~20%
run-to-run with nothing in the logs to explain it beyond that contention (c-serial on the serial
no-keep-alive configuration, mc-forkka and go-nethttp on one of their three keep-alive runs);
best of 3 is reported everywhere and the spread is in the raw results. The HTTP rows are
deliberately out of the cell — their recorded spread is 0.9% to 228.5%, against the workload's
2–8% — and the hour-long soak below is the right protocol for them.
Where mc stands #
The workload: one integer program, six languages #
200,000,000 iterations of a wrapping 64-bit LCG + xorshift mix, a sieve of Eratosthenes over
50,000,000 bytes, and naive recursive fib(38). Every variant printed the same three numbers
(cross-checked, ../bench/RESULTS.md § A).
| Language / variant | Compile (best of 3) | Binary (bytes) | __text (bytes) | Run (best of 3) | Run RSS | Source lines |
|---|---|---|---|---|---|---|
mc --exe | 4.1 ms | 33,461 | 1,480 | 1.09 s | 51.3 MB | 76 |
C clang -O2 | 0.11 s | 33,464 | 1,320 | 0.49 s | 51.4 MB | 50 |
C clang -O0 | 0.09 s | 33,512 | 740 | 1.02 s | 51.4 MB | 50 |
Go go build | 0.08 s warm (5.94 s cold) | 2,492,482 | 649,316 | 0.55 s | 54.8 MB | 55 |
Zig -O ReleaseFast | 9.80 s | 396,304 | 238,804 | 0.50 s | 51.6 MB | 57 |
Rust -O3 | 0.19 s | 466,320 | 216,908 | 0.47 s | 51.6 MB | 59 |
| C# NativeAOT | 3.23 s cold publish | 1,020,584 | 282,276 | 0.62 s | 57.5 MB | 58 |
| C# JIT | 0.54 s (dotnet build) | 5,120 + 78 MB shared runtime | n/a (IL) | 0.59 s | 94.6 MB | 58 |
(Full table with every variant, every failure and the exact build command: ../bench/RESULTS.md § A.)
The same workload in the cell, as ratios #
The table above is the developer's Apple M4 and its absolute seconds are that machine's. The cell's
verdict is a ratio to a clang -O2 built and timed in the same job, which is the only number
that survives a change of machine — and it changes the picture, because mc -O's register allocator
has ten registers on AArch64 and five on x86-64. Run
34783020976, medians of six kept
repetitions, hand-copied from the three committed results.json under
bench/results/2026-09-13-34783020976/ (nothing generates this page):
| cell | phase | mc -O | mc plain | the tooth (plain / -O) |
|---|---|---|---|---|
macos-arm64-macos-15 | whole workload | 1.453x | 2.530x | 1.741 |
mix | 1.420x | 3.439x | 2.422 | |
primes | 1.437x | 2.405x | 1.674 | |
fib | 1.684x | 1.669x | 0.991 | |
linux-arm64-ubuntu-24.04-arm | whole workload | 1.736x | 4.299x | 2.476 |
mix | 1.805x | 6.587x | 3.650 | |
primes | 1.406x | 3.062x | 2.178 | |
fib | 2.043x | 2.587x | 1.266 | |
linux-x86_64-ubuntu-latest | whole workload | 1.690x | 2.196x | 1.299 |
mix | 1.447x | 1.727x | 1.193 | |
primes | 1.692x | 2.737x | 1.618 | |
fib | 2.321x | 2.647x | 1.140 |
Three things worth reading off it. The arithmetic phase is where the optimizer lives: mix is
1.42x clang -O2 on the macOS cell against the plain road's 3.44x. fib is not, anywhere — the
gap there is clang's recursion-to-loop rewrite, which -O does not do, and on the macOS cell -O is
a hair slower than plain on that phase (1.684 against 1.669, inside the noise). And the x86-64
allocator buys 19–21% where AArch64's buys 130–265%, which is the first timing that side has ever
had (M49 step D2 shipped with an instruction count and nothing else).
Toolchain footprint #
| Toolchain | Size on disk | Files | System linker needed | Self-hosting |
|---|---|---|---|---|
| mc | 1.2 MB (one binary, build/mc1) | 1 | No (--exe writes and ad-hoc signs Mach-O itself) | Yes — self-hosted, 2,848-line C23 seed only for bootstrap |
| Go | 258 MB | 14,954 | No (internal linker) | Yes, since 1.5 |
| Zig | 246 MB | 19,548 | No (bundled zig ld) | Yes, since 0.11 |
| Rust | 1.7 GB (+233 MB ~/.cargo) | 54,532 | Yes (cc) | Yes (LLVM backend) |
| .NET | 666 MB | 4,738 | JIT no; NativeAOT yes | Roslyn in C#, CoreCLR in C++ |
| clang | 1.0 GB | 5,109 | Yes (Apple ld) | Yes (C++) |
(Full table with version strings and exact measurement commands: ../bench/RESULTS.md § B.)
The HTTP servers #
Seventeen servers, same contract (GET / → 200 text/plain hello, world\n, verified byte-identical
across all of them, first set and second set each checked on their own), driven with
ab -k -c 64 -n 200000 (64 keep-alive connections) and ab -c 1 -n 50000 (one connection, no
keep-alive), plus oha once per configuration. CPU ms / 1k req is the number comparable across
concurrency models: total server-life CPU time (user+sys, children included) divided by requests
served. The second set (Node single-process and cluster, Rust axum, Python stdlib and uvicorn,
Ruby WEBrick and Puma, PHP's built-in server) is marked with its runtime version in the server
column; its full method, environment and per-run numbers are in
../bench/http2/RESULTS.md.
Keep-alive, 64 connections — best of 3:
| server | req/s | mean ms | peak RSS (group) | CPU ms / 1k req |
|---|---|---|---|---|
| mc-serial (1 proc, 1 conn at a time, no keep-alive) | 28,578 | 2.24 | 2.4 MB | 9.6 |
| mc-forkka (fork per connection, keep-alive) | 120,177 | 0.53 | 66.3 MB | 12.5 |
| mc-fork1 (fork per REQUEST — the registry server's old shape) | 3,892 | 16.44 | 14.6 MB | 335.5 |
| c-serial | 25,128 | 2.55 | 2.4 MB | 8.2 |
| go-nethttp | 103,770 | 0.62 | 22.6 MB | 21.5 |
| rust-threads | 132,595 | 0.48 | 3.8 MB | 11.5 |
| zig-threads | 111,900 | 0.57 | 5.4 MB | 11.5 |
| cs-jit (Kestrel, JIT) | 112,072 | 0.57 | 118.6 MB | 19.2 |
| cs-aot (Kestrel, NativeAOT) | 98,755 | 0.65 | 57.1 MB | 14.3 |
| node-single (Node 24) | 56,679 | 1.13 | 84.8 MB | 17.0 |
| node-cluster (Node 24) | 89,468 | 0.72 | 744.6 MB | 34.8 |
| rust-axum (Rust 1.96, axum 0.8) | 124,042 | 0.52 | 6.8 MB | 16.2 |
| py-stdlib (Python 3.9) | FAILED — ab -k hung, 0 requests completed in warm-up on all 3 runs | - | - | - |
| py-uvicorn (Python 3.9, uvicorn 0.39) | 5,030 | 12.72 | 27.2 MB | 195.0 |
| rb-webrick (Ruby 2.6) | 6,916 | 9.25 | 40.6 MB | 138.0 |
| rb-puma (Ruby 2.6, puma 6.6) | 17,094 | 3.74 | 20.1 MB | 45.3 |
| php-builtin (PHP 8.5) | 15,415 | 4.15 | 30.0 MB | 60.7 |
No keep-alive, 1 connection — best of 3:
| server | req/s | CPU ms / 1k req |
|---|---|---|
| mc-serial | 14,713 | 13.9 |
| c-serial | 13,331 | 11.0 |
| rust-threads | 11,380 | 35.0 |
| zig-threads | 11,091 | 43.3 |
| go-nethttp | 9,522 | 61.9 |
| cs-aot | 9,465 | 159.1 |
| cs-jit | 9,650 | 274.0 |
| mc-fork1 | 2,359 | 344.9 |
| mc-forkka | 2,326 | 342.7 |
| rust-axum (Rust 1.96, axum 0.8) | 11,115 | 48.9 |
| node-single (Node 24) | 10,926 | 41.7 |
| rb-puma (Ruby 2.6, puma 6.6) | 10,249 | 47.9 |
| php-builtin (PHP 8.5) | 9,385 | 56.0 |
| py-stdlib (Python 3.9) | 5,722 | 140.3 |
| node-cluster (Node 24) | 5,885 | 170.3 |
| rb-webrick (Ruby 2.6) | 4,947 | 158.1 |
| py-uvicorn (Python 3.9, uvicorn 0.39) | 2,271 | 331.0 |
oha -c 64 -z 5s (keep-alive), one run:
| server | req/s | mean ms | peak RSS (group) | ps peak %CPU (group) |
|---|---|---|---|---|
| mc-serial | 30,967 | 2.07 | 2.5 MB | 36 |
| mc-forkka | 106,741 | 0.60 | 67.4 MB | 154 |
| mc-fork1 | 3,874 | 16.54 | 3.7 MB | 67 |
| c-serial | 19,289 | 3.31 | 2.5 MB | 14 |
| go-nethttp | 96,171 | 0.66 | 22.8 MB | 220 |
| rust-threads | 171,220 | 0.37 | 3.9 MB | 188 |
| zig-threads | 148,548 | 0.43 | 5.6 MB | 159 |
| cs-jit | 106,425 | 0.60 | 124.4 MB | 177 |
| cs-aot | 121,131 | 0.53 | 66.8 MB | 254 |
| node-single (Node 24) | 55,072 | 1.16 | 85.9 MB | 100 |
| node-cluster (Node 24) | 99,141 | 0.64 | 768.4 MB | 278 |
| rust-axum (Rust 1.96, axum 0.8) | 151,186 | 0.42 | 6.9 MB | 214 |
| py-stdlib (Python 3.9) | 13,280 | 4.74 | 19.5 MB | 108 |
| py-uvicorn (Python 3.9, uvicorn 0.39) | 6,612 | 9.68 | 27.2 MB | 93 |
| rb-webrick (Ruby 2.6) | 5,875 | 10.89 | 40.5 MB | 90 |
| rb-puma (Ruby 2.6, puma 6.6) | 19,685 | 3.24 | 39.1 MB | 108 |
| php-builtin (PHP 8.5) | 15,797 | 4.05 | 30.0 MB | 98 |
py-stdlib's oha keep-alive run succeeded (13,280 req/s) even though its ab -k run did not —
the failure is specific to that combination of ab and ThreadingHTTPServer, not to keep-alive
connections in general; its no-keep-alive number (5,722 req/s, above) is unaffected either way.
(Both ab tables in full, plus the oha -c 1 --disable-keepalive run and the per-run spread:
../bench/http/RESULTS.md and
../bench/http2/RESULTS.md.)
The hour under load #
The first full run of the soak (.github/workflows/bench-soak.yml, protocol in
../bench/README.md § "C. The soak"): every server above plus round 2's,
under a FIXED 3,000 req/s for 60 minutes, one GitHub Actions runner per server, pinned to two of
its four cores (oha and the sampler on the other two), the whole process tree sampled every 5 s.
Full tables, results.json and the SVG time series:
../bench/soak/results/2026-09-06-34062566194/RESULTS.md.
Conditions #
| Runner | ubuntu24 20260831.293.1, GitHub Actions, 4 vCPU (AMD EPYC 7763), 16,373,452 kB — not the Apple M4 above; this cell runs on GitHub's hosted runners, one per server |
| Kernel | Linux 6.17.0-1022-azure x86_64 (Ubuntu 24.04.4 LTS) |
| Pinning | server on cores 0,1; oha and the sampler on cores 2,3 (taskset) |
| Load | oha -z 60m -q 3000 -c 16 --no-tui --output-format json (3,000 req/s, 16 keep-alive connections, oha 1.16.0) |
| Sampling | every 5 s: RSS/CPU time/threads/processes of the whole process tree, VmRSS/VmHWM of the parent, /proc/loadavg |
| Date | 2026-09-06 21:57 UTC |
| Tree | 7d01b3a (run 34062566194) |
| mc | mc 0.15.15 (latest release at run time, checksum-verified) |
| C | Ubuntu clang 18.1.3 |
| Go | go1.26.7 linux/amd64 |
| Rust | rustc 1.96.0 (ac68faa20 2026-05-25) |
| Zig | 0.16.0 |
| .NET | 10.0.400 |
| Node | v24.20.0 |
| Python / uvicorn | Python 3.12.14; uvicorn 0.39.0 — did not run this hour, see below |
| Ruby / puma | ruby 3.3.12; puma 6.6.1 |
| PHP | 8.4.25 (cli, NTS) |
Memory and CPU #
RSS is the sum over the process tree in KiB; slope is the least-squares fit over the fitting
window named in the verdict (after the first 10 minutes, here), with its R²; flat/drifted is a
rule (projected move ≥ 5% of the window's mean AND R² ≥ 0.5), not a judgement.
| server | RSS 10 min | RSS 60 min | slope KiB/min (R²) | verdict | %CPU mean | CPU ms / 1k req | threads max | procs max |
|---|---|---|---|---|---|---|---|---|
| mc-serial | 940 | 940 | +0.0 (1.00) | flat | 7.6 | 25.46 | 1 | 1 |
| mc-forkka | 5,348 | 5,348 | +0.0 (1.00) | flat | 8.1 | 27.07 | 17 | 17 |
| c-serial | 1,124 | 1,124 | +0.0 (1.00) | flat | 7.4 | 24.79 | 1 | 1 |
| go-nethttp | 15,784 | 16,108 | +2.0 (0.08) | flat | 20.9 | 69.48 | 7 | 1 |
| rust-threads | 2,436 | 2,436 | +0.0 (1.00) | flat | 6.8 | 22.52 | 17 | 1 |
| rust-axum | 3,832 | 3,832 | +0.0 (1.00) | flat | 6.4 | 21.22 | 3 | 1 |
| zig-threads | 12,480 | 12,480 | +0.0 (1.00) | flat | 6.8 | 22.53 | 17 | 1 |
| cs-jit | 68,452 | 69,732 | +26.2 (0.98) | flat | 32.5 | 108.37 | 18 | 1 |
| cs-aot | 19,488 | 20,640 | +23.1 (0.96) | drifted | 11.7 | 39.02 | 13 | 1 |
| node-single | 72,496 | 94,128 | +369.6 (0.68) | drifted | 4.8 | 16.00 | 7 | 1 |
| node-cluster | 199,208 | 215,216 | +448.1 (0.80) | drifted | 22.2 | 73.89 | 21 | 3 |
| py-uvicorn | — | — | — | (did not start) | — | — | — | — |
| rb-puma | 46,536 | 47,304 | +12.8 (0.91) | flat | 21.1 | 70.46 | 12 | 1 |
| php-builtin | 142,256 | 564,400 | +8437.6 (1.00) | drifted | 35.3 | 117.68 | 1 | 1 |
Throughput and latency #
req/s is what oha achieved against 3,000 asked; latencies in ms from oha's own histogram;
startup is time to the first 200. Every server served effectively all 10,800,000 requests the
hour asks for (0–11 connection-level errors each, the normal way a timed run ends: oha aborts
its still-open connections at the deadline).
| server | req/s (asked 3,000) | p50 | p99 | p99.9 | startup |
|---|---|---|---|---|---|
| mc-serial | 3,000.0 | 0.168 | 0.302 | 0.418 | 8 ms |
| mc-forkka | 3,000.0 | 0.077 | 0.118 | 0.150 | 8 ms |
| c-serial | 3,000.0 | 0.167 | 0.306 | 0.477 | 8 ms |
| go-nethttp | 3,000.0 | 0.122 | 0.219 | 0.354 | 24 ms |
| rust-threads | 3,000.0 | 0.073 | 0.116 | 0.148 | 9 ms |
| rust-axum | 3,000.0 | 0.057 | 0.081 | 0.322 | 100 ms |
| zig-threads | 3,000.0 | 0.070 | 0.114 | 0.151 | 8 ms |
| cs-jit | 3,000.0 | 0.122 | 0.181 | 0.386 | 851 ms |
| cs-aot | 3,000.0 | 0.071 | 0.101 | 0.137 | 61 ms |
| node-single | 3,000.0 | 0.041 | 0.082 | 0.444 | 127 ms |
| node-cluster | 3,000.0 | 0.127 | 0.232 | 0.290 | 129 ms |
| py-uvicorn | — | — | — | — | (did not start) |
| rb-puma | 3,000.0 | 0.163 | 38.476 | 41.994 | 672 ms |
| php-builtin | 3,000.0 | 0.318 | 0.719 | 1.699 | 58 ms |
Charts #
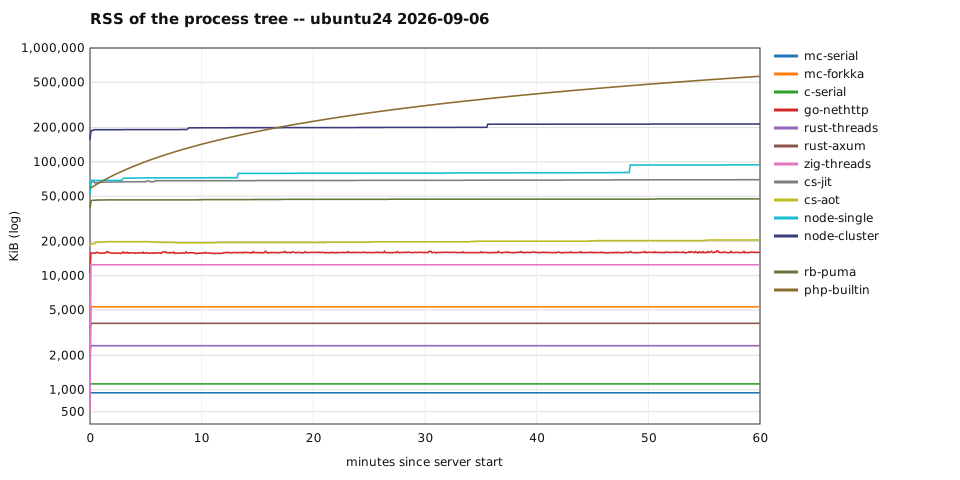
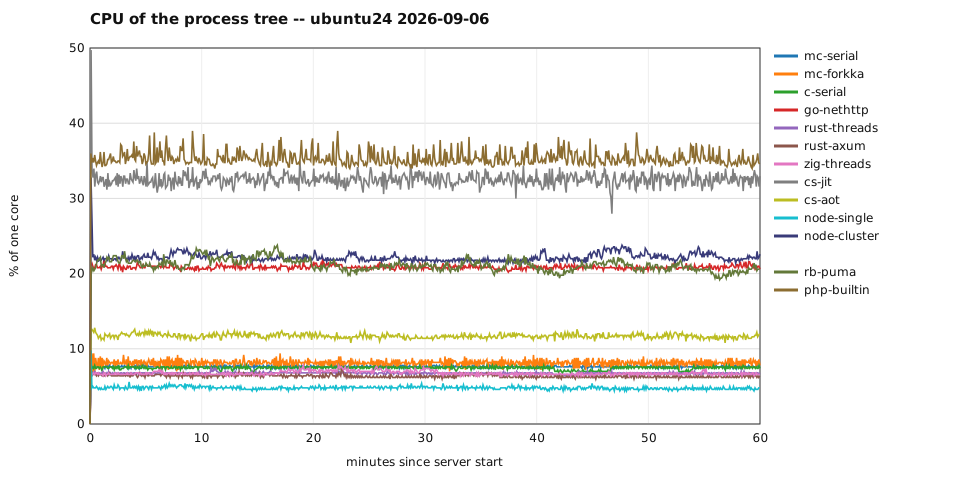
The full set -- rss.svg, cpu.svg, threads.svg and one three-panel chart per server -- is in
../bench/soak/results/2026-09-06-34062566194/RESULTS.md
(same directory on disk).
Verdicts, verbatim #
mc-serial: RSS 940 -> 940 KiB over minutes 10-60 (+0.0%), slope +0.0 KiB/min (R^2 1.00), peak 940 KiB: flatmc-forkka: RSS 5,348 -> 5,348 KiB over minutes 10-60 (+0.0%), slope +0.0 KiB/min (R^2 1.00), peak 5,348 KiB: flatc-serial: RSS 1,124 -> 1,124 KiB over minutes 10-60 (+0.0%), slope +0.0 KiB/min (R^2 1.00), peak 1,124 KiB: flatgo-nethttp: RSS 15,784 -> 16,108 KiB over minutes 10-60 (+2.1%), slope +2.0 KiB/min (R^2 0.08), peak 16,556 KiB: flatrust-threads: RSS 2,436 -> 2,436 KiB over minutes 10-60 (+0.0%), slope +0.0 KiB/min (R^2 1.00), peak 2,436 KiB: flatrust-axum: RSS 3,832 -> 3,832 KiB over minutes 10-60 (+0.0%), slope +0.0 KiB/min (R^2 1.00), peak 3,832 KiB: flatzig-threads: RSS 12,480 -> 12,480 KiB over minutes 10-60 (+0.0%), slope +0.0 KiB/min (R^2 1.00), peak 12,480 KiB: flatcs-jit: RSS 68,452 -> 69,732 KiB over minutes 10-60 (+1.9%), slope +26.2 KiB/min (R^2 0.98), peak 69,988 KiB: flatcs-aot: RSS 19,488 -> 20,640 KiB over minutes 10-60 (+5.9%), slope +23.1 KiB/min (R^2 0.96), peak 20,640 KiB: driftednode-single: RSS 72,496 -> 94,128 KiB over minutes 10-60 (+29.8%), slope +369.6 KiB/min (R^2 0.68), peak 94,396 KiB: driftednode-cluster: RSS 199,336 -> 215,216 KiB over minutes 10-60 (+8.0%), slope +448.1 KiB/min (R^2 0.80), peak 215,776 KiB: driftedpy-uvicorn: no RSS window (server did not answer 200 within 90 s (exit 2))rb-puma: RSS 46,536 -> 47,304 KiB over minutes 10-60 (+1.7%), slope +12.8 KiB/min (R^2 0.91), peak 47,304 KiB: flatphp-builtin: RSS 143,024 -> 564,400 KiB over minutes 10-60 (+294.6%), slope +8437.6 KiB/min (R^2 1.00), peak 564,784 KiB: drifted
Reading it #
Every server with a compiled, ahead-of-time runtime underneath it — mc in both shapes, C, Go,
both Rust servers, Zig — holds its RSS flat to within a few KiB over the full hour, and four of
those five fit their slope with an R² of 1.00 (a perfectly straight, perfectly flat line — Go's
0.08 says the opposite, a slope with no explanatory power, i.e. noise around a flat mean, not a
trend). The two JIT/managed runtimes split: C# under Kestrel/JIT drifted +1.9% and does not clear
the 5%-of-window rule (flat), but its own NativeAOT build — no JIT, no GC warm-up to finish —
drifts +5.9% over the same hour and does. Node's event loop drifts hardest of the JavaScript/managed
group: +29.8% single-process, +8.0% in cluster mode (11 processes sharing the RSS, so the
per-process share of that drift is smaller even though the aggregate crosses the rule). PHP's
built-in development server is the outlier by an order of magnitude — RSS goes from 143 MB to
564 MB over the hour (+295%, R²=1.00, a process that leaks at a constant rate and never stops) —
which is consistent with it being explicitly a development tool, not a production server, in PHP's
own documentation. Ruby's Puma holds flat (+1.7%). On CPU per 1,000 requests, mc (25.46 serial,
27.07 fork-per-connection) sits in the same band as the other compiled servers — C 24.79,
Rust threads 22.52, Rust axum 21.22, Zig 22.53 — a few CPU ms apart, all under 30; Node's
single-process event loop is the lowest of everything measured this hour at 16.00 ms/1k, ahead of
every compiled server, which is the event-loop model paying almost nothing per request once the
JIT is warm. py-uvicorn has no row: the workflow's own UVICORN_VERSION environment variable
collided with uvicorn's click-based CLI (which reads any UVICORN_<OPTION> variable
automatically — auto_envvar_prefix="UVICORN" — so UVICORN_VERSION=0.39.0 was read as the value
of uvicorn's own --version flag, a boolean, and the process refused to start: Error: Invalid
value for '--version': '0.39.0' is not a valid boolean); the workflow now uses
PY_UVICORN_VERSION instead, and py-uvicorn's hour has not been re-run.
Reading the numbers #
Compile time, binary size and toolchain size are where mc leads everything measured here.
4.1 ms to build the workload (clang -O2's own compile is 27x slower at 0.11 s; Zig's optimized
build is 2,400x slower at 9.8 s), a 33 KB executable matching clang -O2's within 3 bytes with no
linker involved, and a 1.2 MB single-file toolchain against Rust's 1.7 GB or clang's 1.0 GB. No
.dll/.so to find at run time, no SDK to install, no linker to configure — build/mc1 alone
compiles and signs a working macOS executable.
The default road is at clang -O0 level; -O closes most of the gap and is now MEASURED, not
estimated. The numbers in the table above are the DEFAULT road, where mc does constant folding
and nothing else: 1.09 s, between clang -O0 (1.02 s) and clang -O2 (0.49 s). Since M49 the same
compiler takes -O, and on the same workload and the same host that road measures 0.548 s
against clang -O2's 0.420 s — 1.30x (wall clock, best of nine, the binaries interleaved; three
runs at growing repetition counts gave 1.29x, 1.31x and 1.29x, so the host's own 2% spread
straddles the figure). Per phase: the arithmetic loop reaches parity (0.216 s against clang's
0.215), the sieve is 0.202 against 0.138 — the remaining gap is clang -O2's NEON vectorisation of
the counting loop — and fib(38) is 0.132 against 0.073, a gap that is the number of CALLS and not
the quality of the code between them (clang -O2 turns one of the two recursive calls into a loop).
The compiler's own __text is 10% SMALLER with -O than without.
What -O is: the callee-saved registers (x19..x28) allocated to locals and parameters by weighted
use count, two emission-time peepholes that fuse a comparison into the branch reading it, and a
loop's invariant constants and global addresses materialised once at function entry
(guide/15-optimizing.md,
reference/machine.md § 5). What it is not: there is still no inlining, no
constant propagation, no unrolling and no vectorisation (surface.md), and the
x86-64 machines have not been taught the allocator yet, so --opt=1 on a Linux or Windows x86-64
target is accepted and does nothing. The default stays 0 — the plain road is the determinism
reference and the seed for every foreign bootstrap chain — so a project opts in with one flag or
one [project].opt line.
Both roads are self-hosting and they agree on the compiler: an mc built with -O compiles
src/mc.mc to byte for byte the object the plain one writes
(bootstrap.md § The optimized chain).
In the HTTP benchmark, the concurrency MODEL decides more than the language does. mc-forkka
(fork per connection, the process kept alive across a connection's requests) is in the same band
as Rust/Zig/Go/Kestrel — 120k req/s, and at 12.5 CPU ms per 1,000 requests it is the second-lowest
CPU cost measured, behind only Rust and Zig's raw thread-per-connection servers (11.5). The serial
shape (mc-serial, one connection at a time, no keep-alive) is at parity with the equivalent C
server (28,578 vs 25,128 req/s, 9.6 vs 8.2 CPU ms/1k — close enough to be inside this host's
~20% run-to-run variance). The shape to retire is fork-per-request (mc-fork1): it is the
examples/api / early registry-server pattern, and at 3,892 req/s with 335 CPU ms per 1,000
requests it costs 28x the CPU of the keep-alive shape for a fifth of the throughput — the fork()
and waitpid() overhead dominates once every request pays for a fresh process. Memory tells the
same story from a different angle: the mc-forkka PARENT holds 1.3 MB RSS the whole time; the 65
worker processes it fans out to under load sum to 66 MB, against Rust's 3.9 MB (65 threads in one
process), Go's 22 MB, or C#'s 118 MB (Kestrel/JIT) — a process-per-connection design pays in
per-process baseline (stack, TLS, libSystem's own footprint) what a thread-per-connection or
event-loop design does not.
The second HTTP set lands where each runtime's model predicts, one order of magnitude apart in
two steps. Node's single-process event loop (node-single) reaches 47% of mc-forkka's
keep-alive throughput (56,679 vs 120,177 req/s, ab -k) at 1.4x the CPU per request (17.0 vs
12.5 CPU ms/1k req) — one JS thread against mc-forkka's process-per-connection fan-out. Node's
cluster mode (11 processes: 1 primary + os.availableParallelism() = 10 workers sharing the
listening socket) closes most of that gap to 75% of the throughput (89,468 req/s) but at 727 MB
of combined RSS across those 11 processes and 2.8x the CPU (34.8 ms/1k) — the primary alone stays
under 52 MB, the ten workers are where the memory and the CPU go. Rust's axum (0.8, on hyper 1
and a multi-thread tokio runtime) lands inside the same 120k–133k req/s band as mc-forkka and
rust-threads (124,042 req/s), between Node's CPU cost and mc's own (16.2 vs 17.0 and 12.5 ms/1k)
— a general-purpose async framework paying a little more than a hand-rolled thread-per-connection
loop, and about the same as mc's own fork-per-connection shape. The four servers with no
compiled runtime underneath the request path — py-uvicorn, rb-webrick, rb-puma,
php-builtin — sit an order of magnitude below that band (5,030–17,094 req/s) at 3 to 16x the
CPU per request (45.3–195.0 ms/1k against mc-forkka's 12.5). py-stdlib's ab -k run failed
outright — 0 requests completed in warm-up on all three attempts, the same ThreadingHTTPServer
that its own no-keep-alive run (5,722 req/s) and its oha keep-alive run (13,280 req/s) both
completed without incident, so the failure is specific to that combination of ab and the
server, not to keep-alive itself (../bench/http2/RESULTS.md § Notes).
What is not measured, and is not comparable #
- No floating-point workload.
<float>is a library, not core (f32/f64viatype_new+ a derived machine,surface.md§ M24); neither benchmark here exercises it. - No GC-pressure test.
mcallocates nothing itself (no core allocator); Go and C# pay a GC under sustained allocation that a pointer-free integer workload never triggers. - No I/O-bound test beyond the HTTP servers, and those are all
GET /returning a fixed 13-byte body — no database, no disk, no JSON parsing. - One host, one architecture (Apple M4 / arm64).
mcalso targetsx86_64(macOS via Rosetta is not tested; Linux/Windows x86_64 are supported build targets —machine_x86_64.mc— but not benchmarked here) and RISC-V/AVR bare metal, none measured in this pass. - The second HTTP set (Node single-process and
cluster, Rustaxum, Python, Ruby, PHP) is now merged into the tables above and read in § Reading the numbers. Its full method, environment and every command run are in../bench/http2/RESULTS.md; the sources are in../bench/http2/. - The soak (§ "The hour under load") only ran once, on 2026-09-06, and
py-uvicornis not in it. A single hour is one data point, not a trend line across runs; a GitHub-hosted runner is shared hardware (../bench/README.md§ "The runner caveat"), so a second hour on a different day could move the noisier rows (Go's+2.0 KiB/min, R²=0.08is noise by its own fit).py-uvicorn's row is a workflow defect (UVICORN_VERSIONcolliding with uvicorn's ownclickauto-envvar prefix), now fixed; its hour has not been re-run. - No connection churn. The soak holds 16 keep-alive connections open for the whole hour
(
--disable-keepaliveexists as an option and was not used this run); a server's behaviour under connections opening and closing continuously — the shape a real front end sees — is untested. - The soak's hour is still short next to a service's uptime.
php-builtin's slope (+8,437.6 KiB/min) would exhaust a small container's memory in well under a day; whether the otherdriftedrows (Node, C# NativeAOT) are heading somewhere similar or asymptoting is a question a longer window would answer and this one does not.
Feature matrix #
Facts only — cited to the reference docs for mc, from general knowledge of each language's
current version elsewhere (../bench/RESULTS.md § D has the full row-by-row citations; this is
the summary).
| Feature | mc | C | Go | Zig | Rust | C# |
|---|---|---|---|---|---|---|
| Generics | No in the core; taught by examples/lang from the surface | No | Yes | Yes (comptime) | Yes (monomorphized) | Yes (runtime, CLR) |
| Structs | No struct; #define offsets + accessors, or class/interface taught (examples/api) | Yes | Yes | Yes | Yes | Yes |
| Floats | None in the core; <float> is the first library primitive | Yes | Yes | Yes (f16..f128) | Yes | Yes |
| Strings | Literals only, no string type | char arrays + libc | Built-in string | []const u8 | String/&str | System.String |
| Error handling | Diagnostic + exit code; no language construct | Return codes/errno | Multiple returns, error, panic | !T, try/catch | Result/?, panics | Exceptions |
| Memory safety | Unchecked; raw ld*/st* on uptr | Unchecked | GC + bounds checks | Checked in Debug/ReleaseSafe | Ownership/borrowing | GC + bounds checks |
| GC | None; reference counting taught by examples/lang | None | Tracing, concurrent | None (explicit allocators) | None (RAII) | Tracing, generational |
| Concurrency | None in the core; taught by examples/conc | pthreads (library) | Goroutines, channels (built in) | std.Thread, atomics | Threads, atomics, async | Threads, Task/async |
| Optimizer | Constant folding only | LLVM -O0..-O3 | SSA, inlining, DCE | LLVM or self-hosted | LLVM -O0..-O3 | RyuJIT tiered + PGO |
| Register allocation | None (fixed depth scheme) | Yes | Yes | Yes | Yes | Yes (RyuJIT LSRA) |
| Cross targets shipped | macOS/Linux/Windows arm64+x86_64, RISC-V and AVR bare metal | Many (LLVM) | Many (GOOS/GOARCH) | Many (LLVM) | Many (rustup) | osx/linux/win RIDs |
| Package manager | Yes (mc pkg, [deps], mc.lock, MVS) | None | Go modules | zig fetch | cargo | NuGet |
| LSP / Debugger | Planned (M28/M30), not shipped | clangd, DWARF/lldb | gopls, DWARF/delve | zls (3rd party), DWARF | rust-analyzer, DWARF/lldb | Roslyn LSP, PDB |
| Reproducible builds | Byte-identical fixed point, SHA-256 goldens | Mostly, with effort | Yes by design | Yes (content-addressed) | Yes in practice | Deterministic IL |
| Compiler extensibility | Four tiers in the language: directives, pass()/backend()/machine(), six word registrations + seven hooks, intrinsic | None (preprocessor) | None (go generate, external) | comptime (nearest analogue) | proc-macros (nearest analogue) | Source generators (nearest analogue) |
Where to improve #
Ranked by what it buys. Item 1 is now MEASURED and largely DONE; the rest are estimates, and each
links to the milestone that would carry it in plan.md.
- A register allocator, a peephole and loop-invariant hoisting — done, measured, 1.30x. This
was the single biggest lever on the one gap this page shows, and M49 took it:
mc -Oallocatesx19..x28to locals and parameters by weighted use count, fusescmp/cset/branch into oneb.<cond>, and materialises a loop's invariant constants and global addresses once at function entry. Measured on this workload and this host: 0.548 s againstclang -O2's 0.420 s, 1.30x, with the arithmetic phase at parity — against the 2.2x the default road shows and against the "estimated target: within 1.3x" this item used to carry as a guess. What is still open and still an estimate: inlining and constant propagation aspass()-level AST rewrites (deferred by M49 § 10 with its own spec and its own measurement first, and worth 0 on this workload —fib's gap is clang's recursion-to-loop rewrite, which inlining does not reach). The x86-64 machines have the same allocator since M49 step D2, and M50's cell gave it its first timing: 19–21% on themixphase, against 130–265% on AArch64, because it allocates five registers there (rbx,r12..r15) against AArch64's ten — somc -Ois 1.45xclang -O2on that phase onubuntu-latest(§ "The same workload in the cell"). Whether the two registers Win64 makes callee-saved (rdi,rsi) are worth adding is now a question with a measurement in front of it, which is what M49 § 12 risk 11 was waiting for. Seeplan.md§ M49 andguide/15-optimizing.md. - A reproducible bench cell — done (M50). One GitHub Actions job per toolchain on three cells,
every version pinned in one file, a release tarball whose
.sha256is verified before unpacking, the SHA-256 of every binary timed, and each run committed as dated JSON underbench/results/so a regression is agit blame. It replaced both caveats the § Conditions block used to carry. The plan row'sbench/Dockerfile-on-a-fixed-VPS shape was measured against and refused — the VPS is production and is itself a shared VM, and Actions is the only road with both architectures — and is kept priced as an option for a road off GitHub. Seeplan.md§ M50 andspecs/M50.md. - A bundled
<http>library with the fork-per-connection-with-keep-alive shape (mc-forkkaabove) as an#include <http>away, with an event-loop shape to follow once one exists, so a program gets the 120k-req/s band by including a library instead of hand-rolling sockets — and so the registry server itself (minicompiler/mc-registry) can move off its current fork-per-request shape onto it. The registry server's own migration isminicompiler/mc-registry's work, not this repository's — this repository only owns the library. Seeplan.md§ M51. - The LSP, the debugger, and the rest of the feature matrix's blanks the plan already names:
mc lsp(M28), DWARF +lldb(M30), and the register-allocator work above is itself a prerequisite this page did not know it had until it was measured.